Find interesting products, stories and categories tailored for you.
Here Documentry write about create item
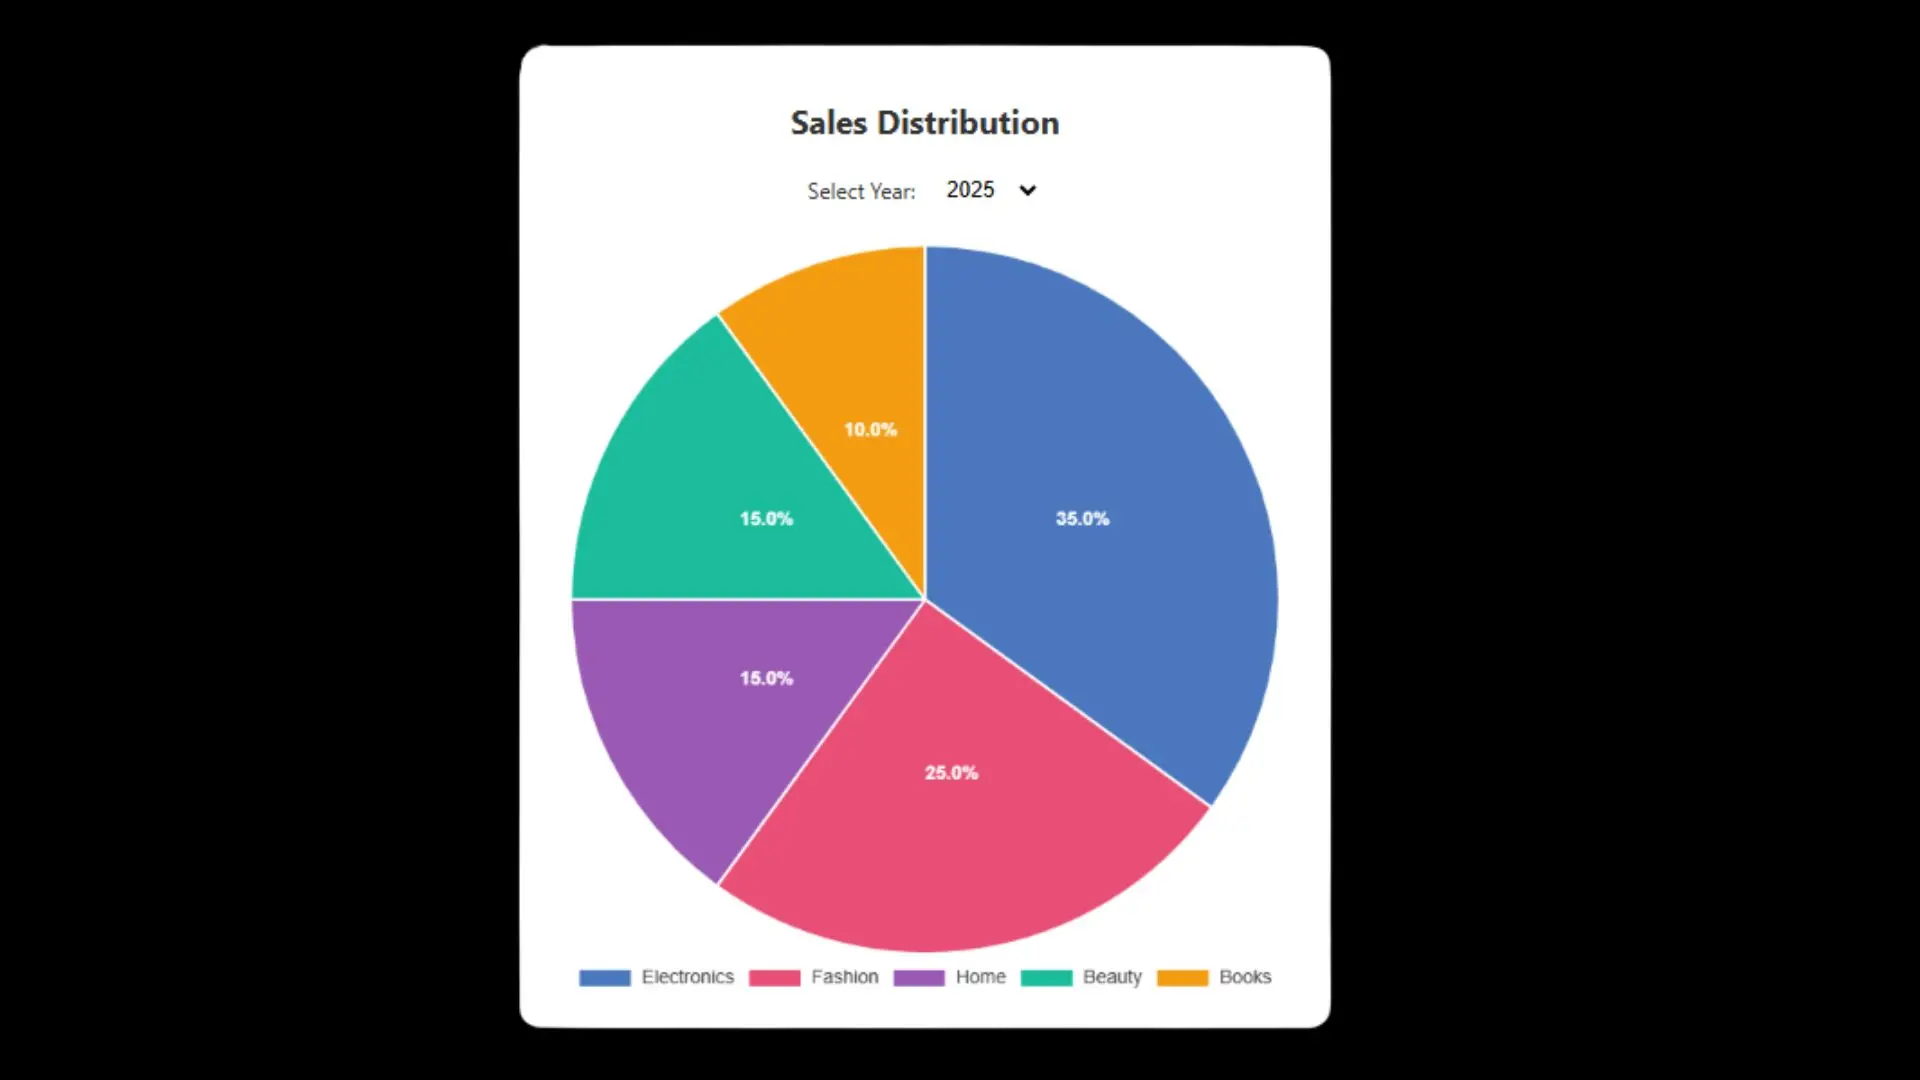
Create interactive and visually appealing pie charts using Chart.js with built-in year-based filtering! This responsive Pie Chart component is perfect for dashboards, analytics panels, or eCommerce reports. Users can seamlessly switch between 2024 and 2025 to view sales distribution across categories like Electronics, Fashion, Home, Beauty, Books, and more.
With built-in ChartDataLabels support, the chart dynamically shows percentages for each slice, enhancing clarity and professional data presentation. The minimalistic design ensures compatibility with both light and dark themes.
Ideal for SaaS platforms, admin panels, product analytics, business intelligence dashboards, and any web project requiring beautiful and clear data visualization.

Be the first to know. Subscribe today and unlock exclusive deals!
Working Days / Hours!
Free support line!
Orders Support!

