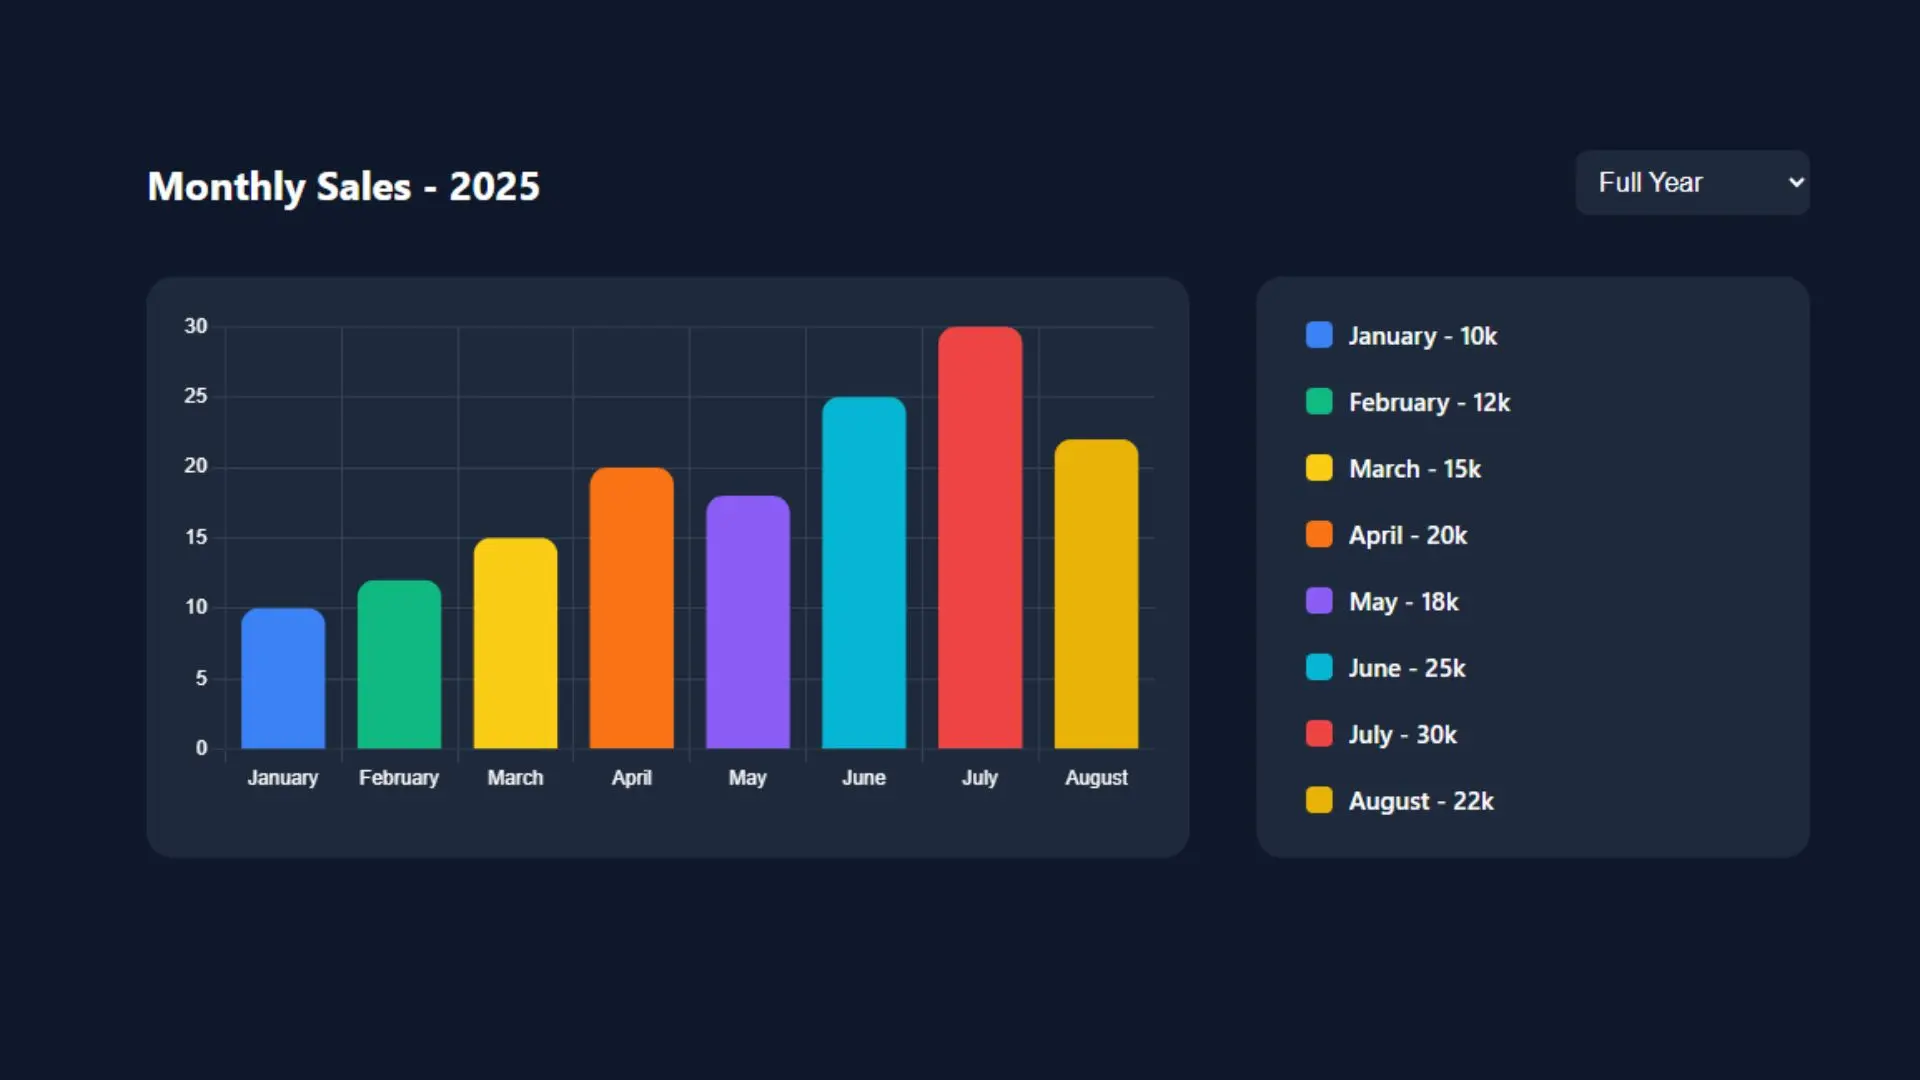
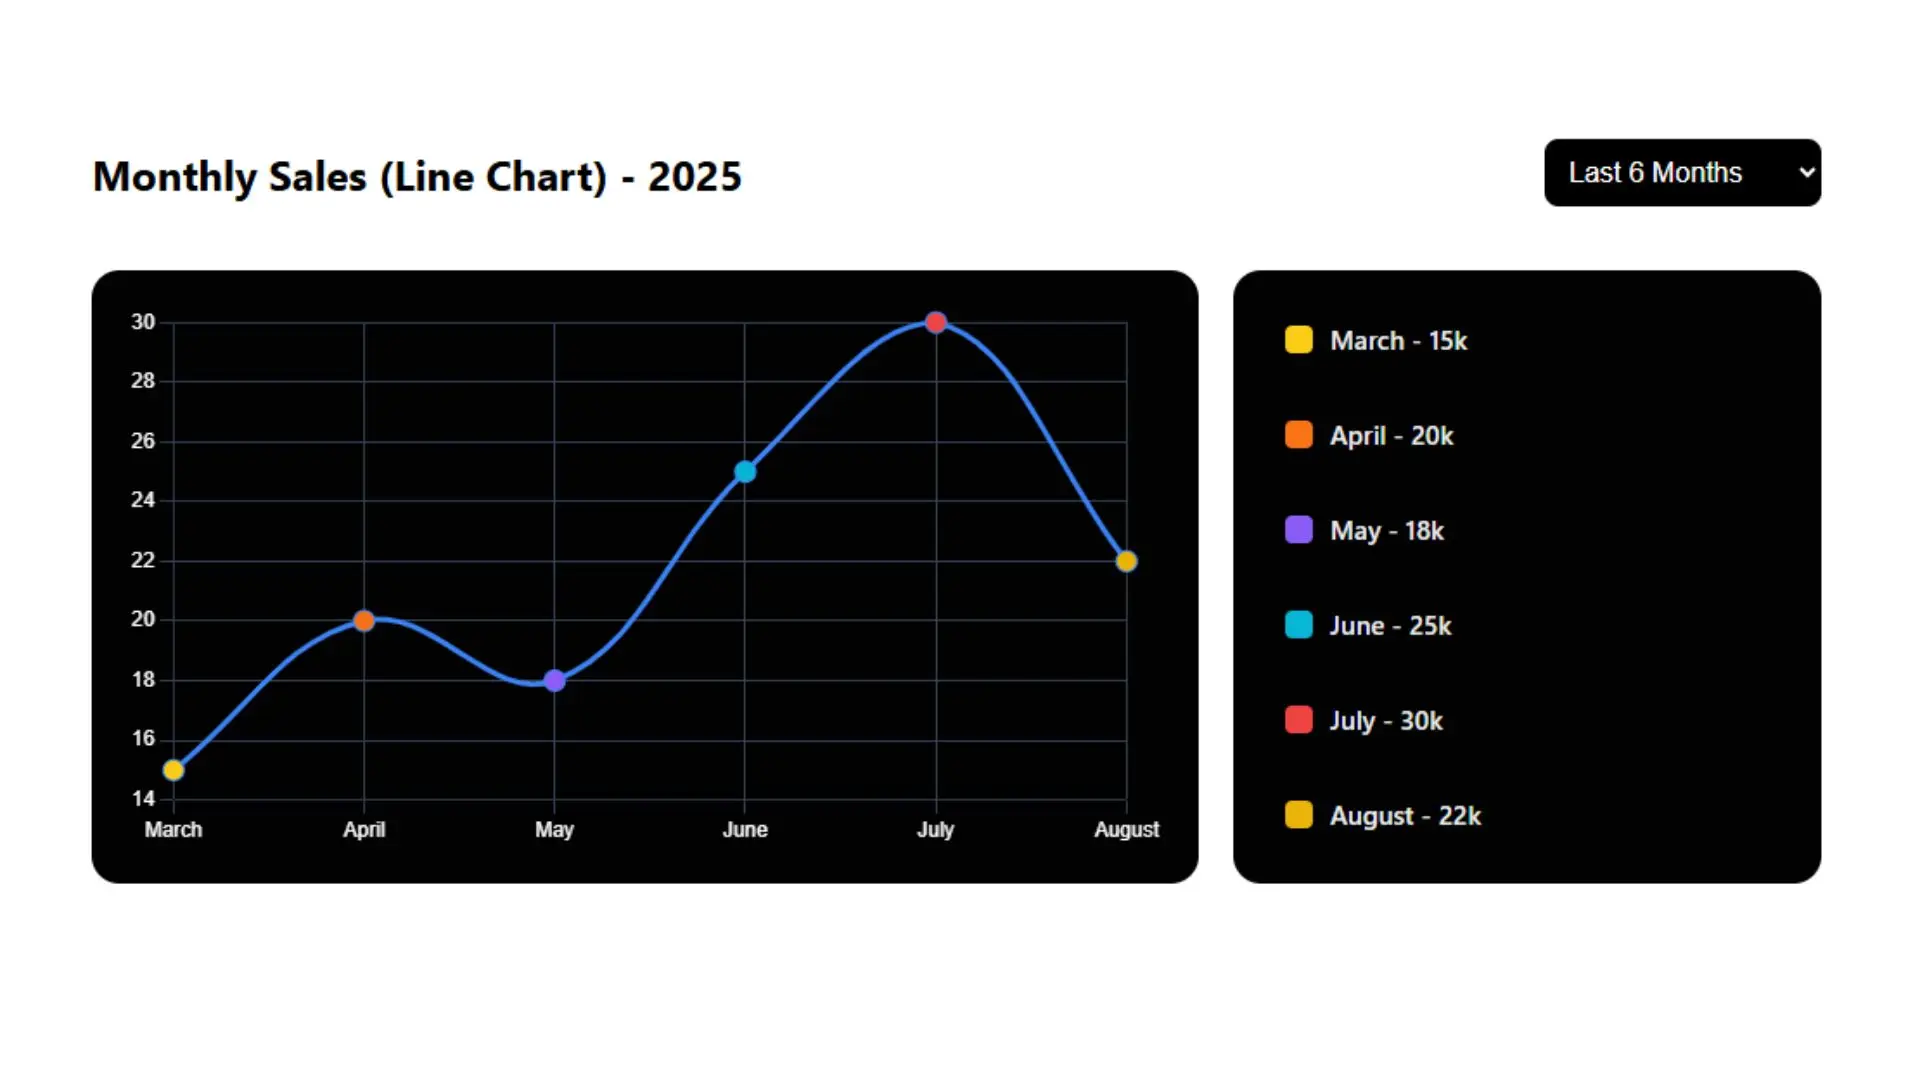
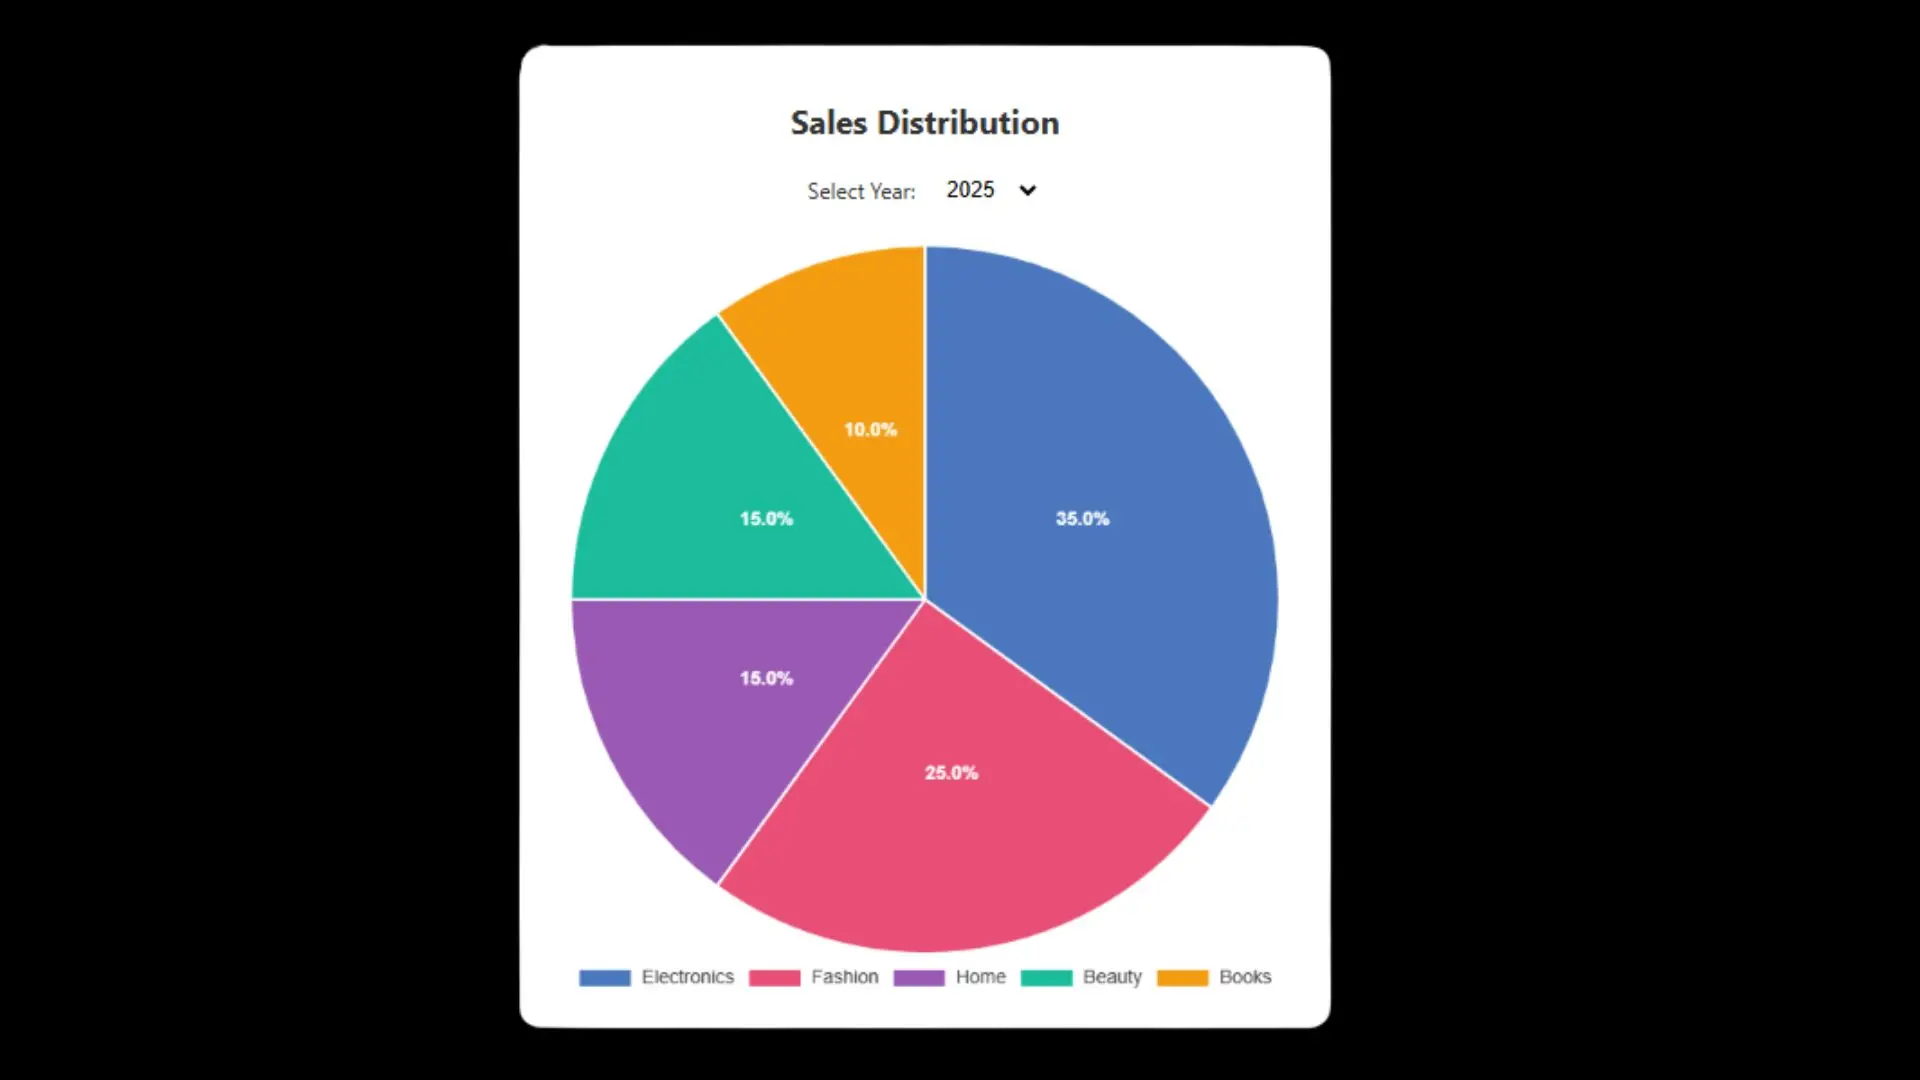
Our Charts component supports a wide range of chart types, including bar charts, line charts, pie charts, and area charts. You can also create advanced visualizations like scatter plots and radar charts. The component is flexible enough to handle both simple and complex datasets. This ensures you can choose the right chart type for your specific reporting needs.
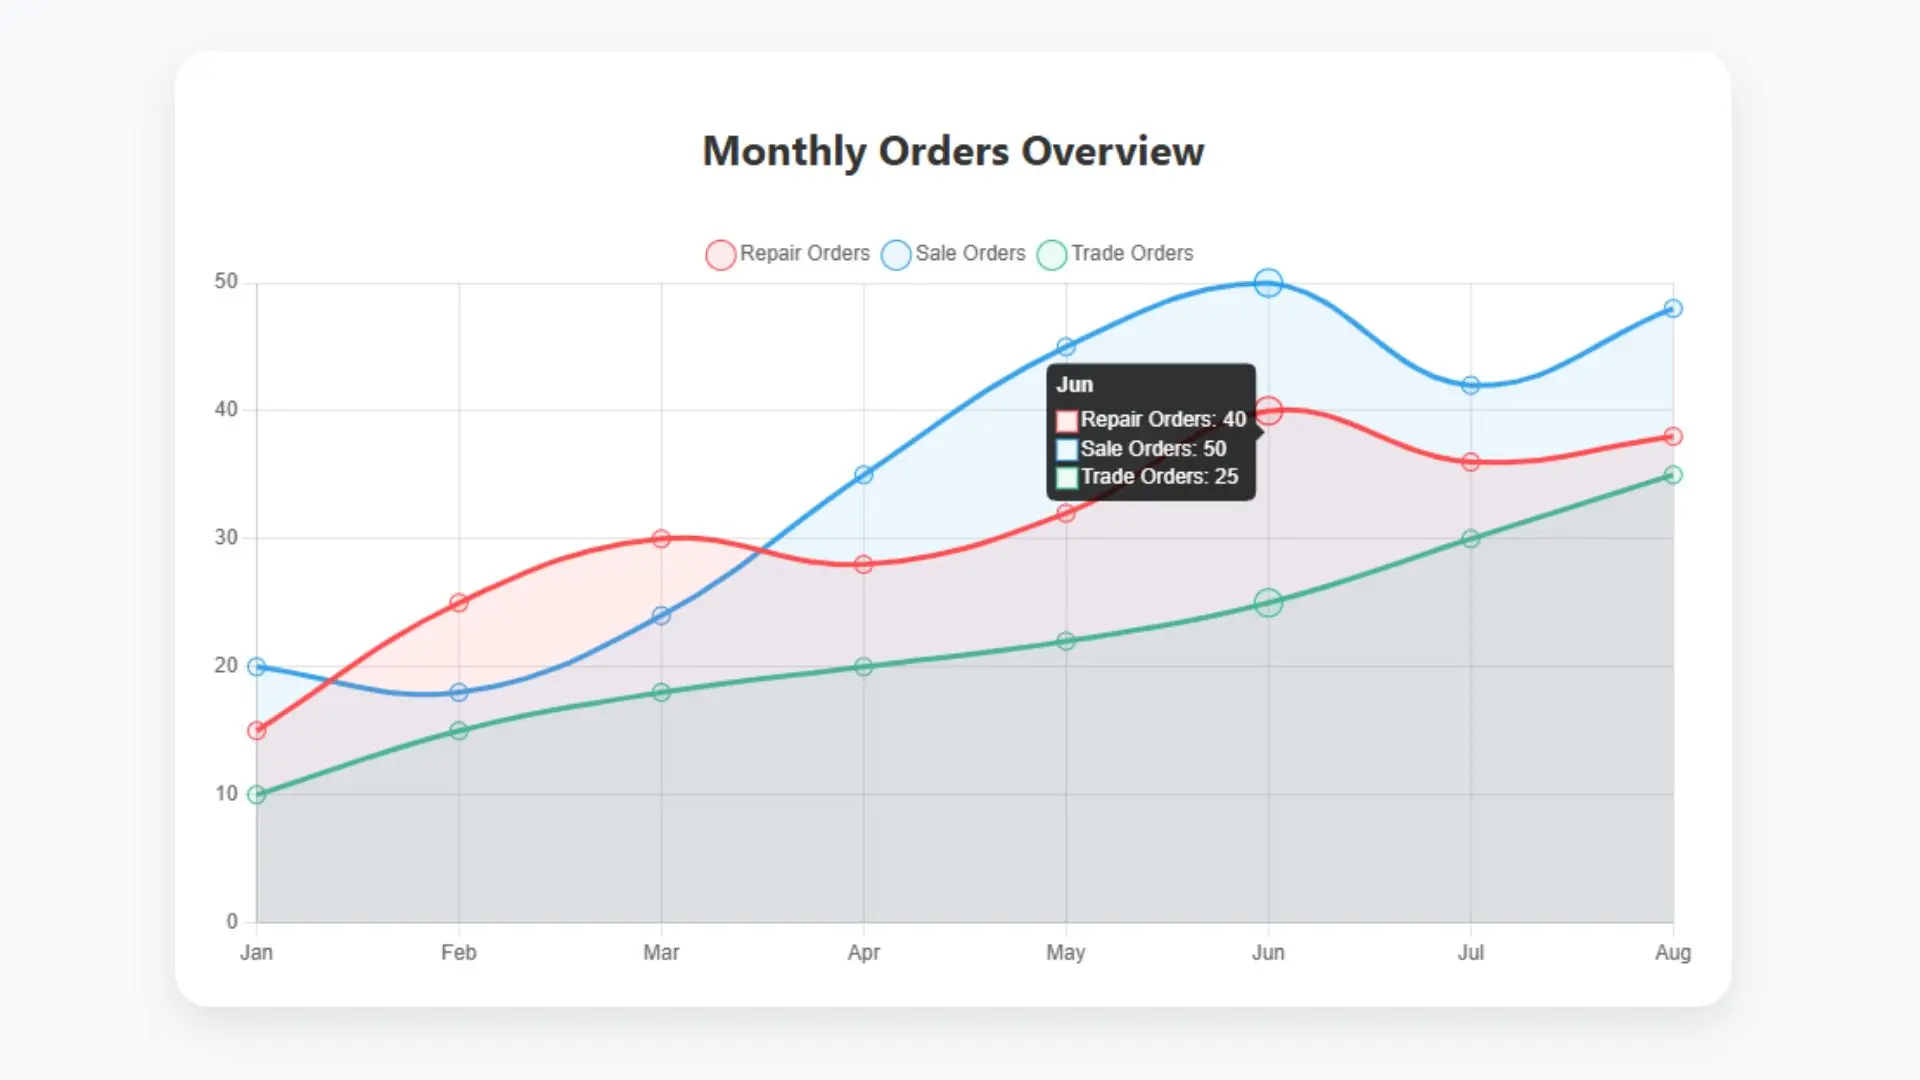
Yes, the Charts component offers full customization options for colors, fonts, grid lines, and legends. You can adjust the layout to match your brand’s style and theme. It also supports custom tooltips and animations for better user interaction. This way, you can create data visuals that are not only functional but also visually appealing.
The Charts component is optimized to handle large datasets efficiently without slowing down the page. It uses smart rendering techniques to ensure smooth performance even when displaying thousands of data points. You can also implement pagination or dynamic data loading. This helps maintain speed while still providing comprehensive insights.
Yes, our Charts component is fully responsive, ensuring charts scale automatically to fit different screen sizes. Whether viewed on desktop, tablet, or mobile devices, the charts maintain clarity and usability. Interactive elements like tooltips and zooming work seamlessly on touch screens. This guarantees a consistent user experience across all devices.