2
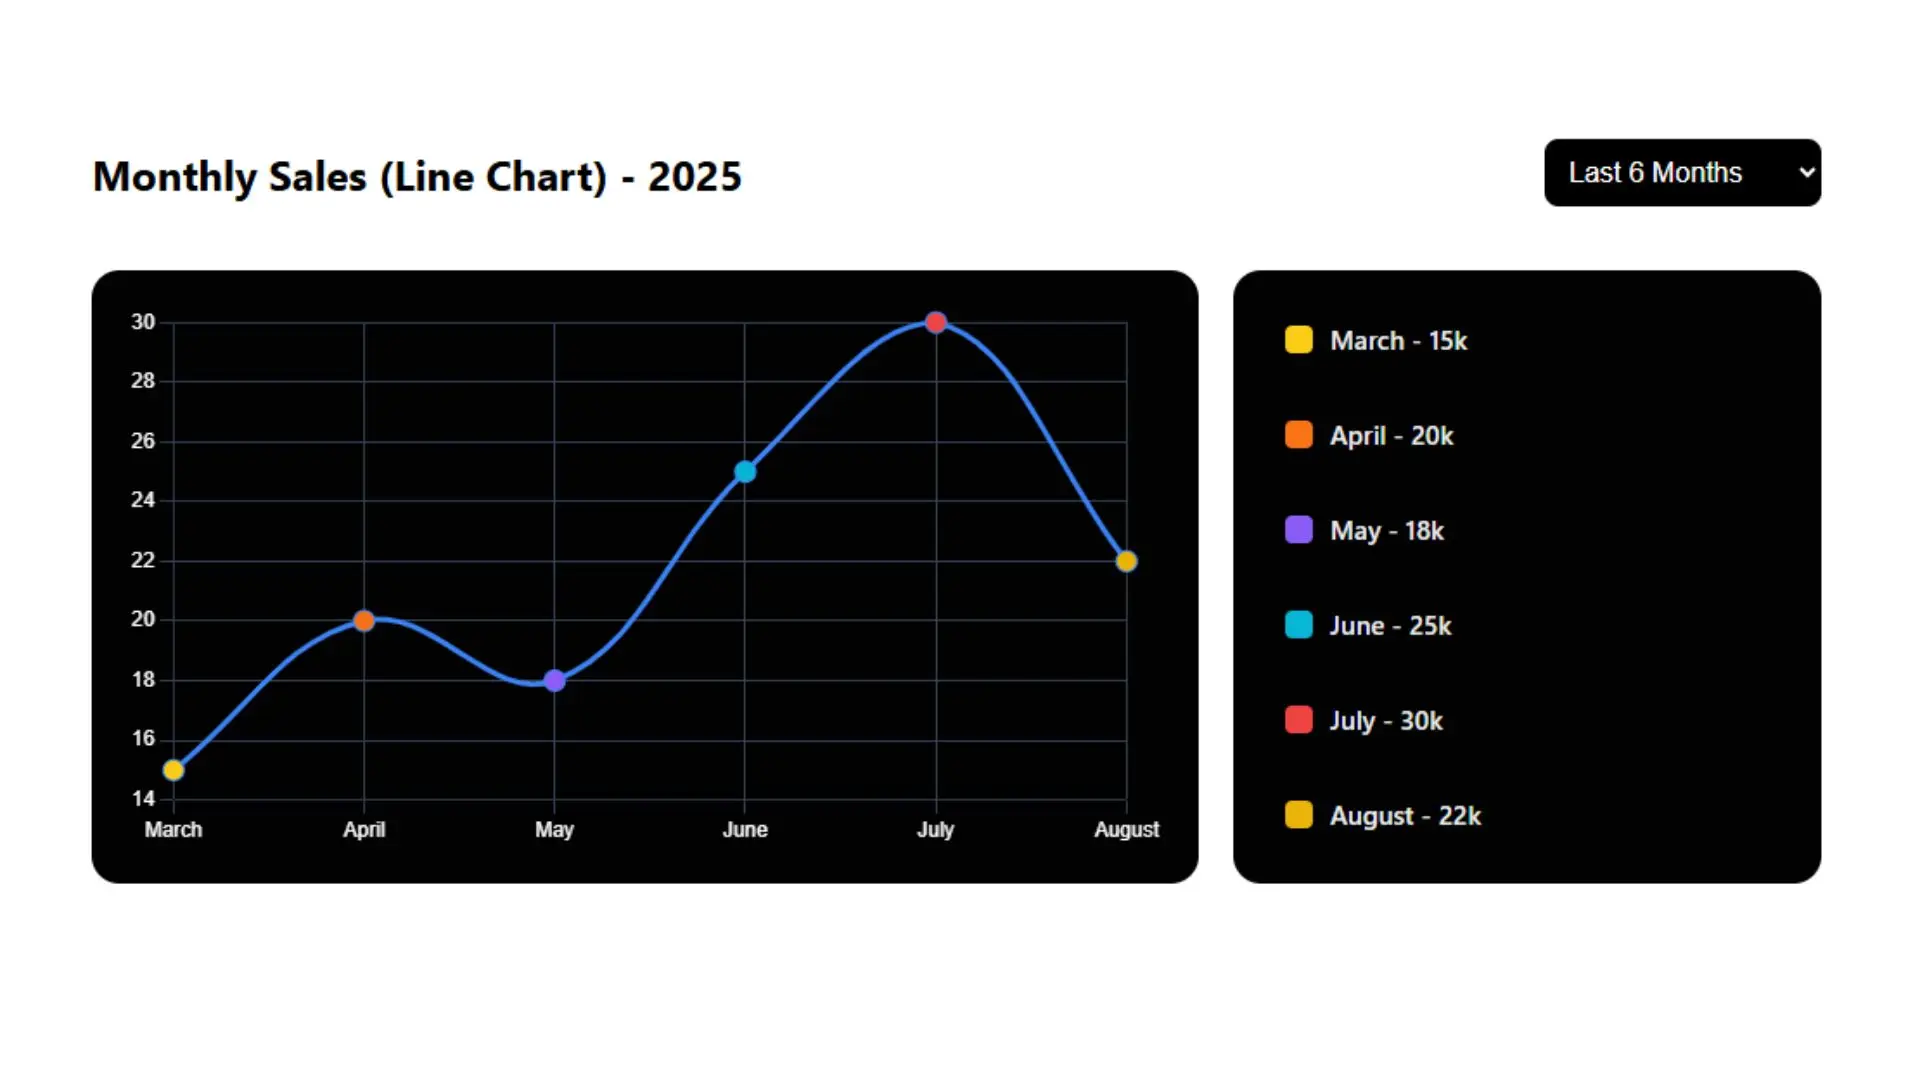
The Responsive Line Sales Chart Component is a sleek, mobile-friendly data visualization tool built using HTML, CSS, JavaScript, and Chart.js. It visually tracks monthly sales trends using a modern line chart format with point indicators and a fully interactive legend.
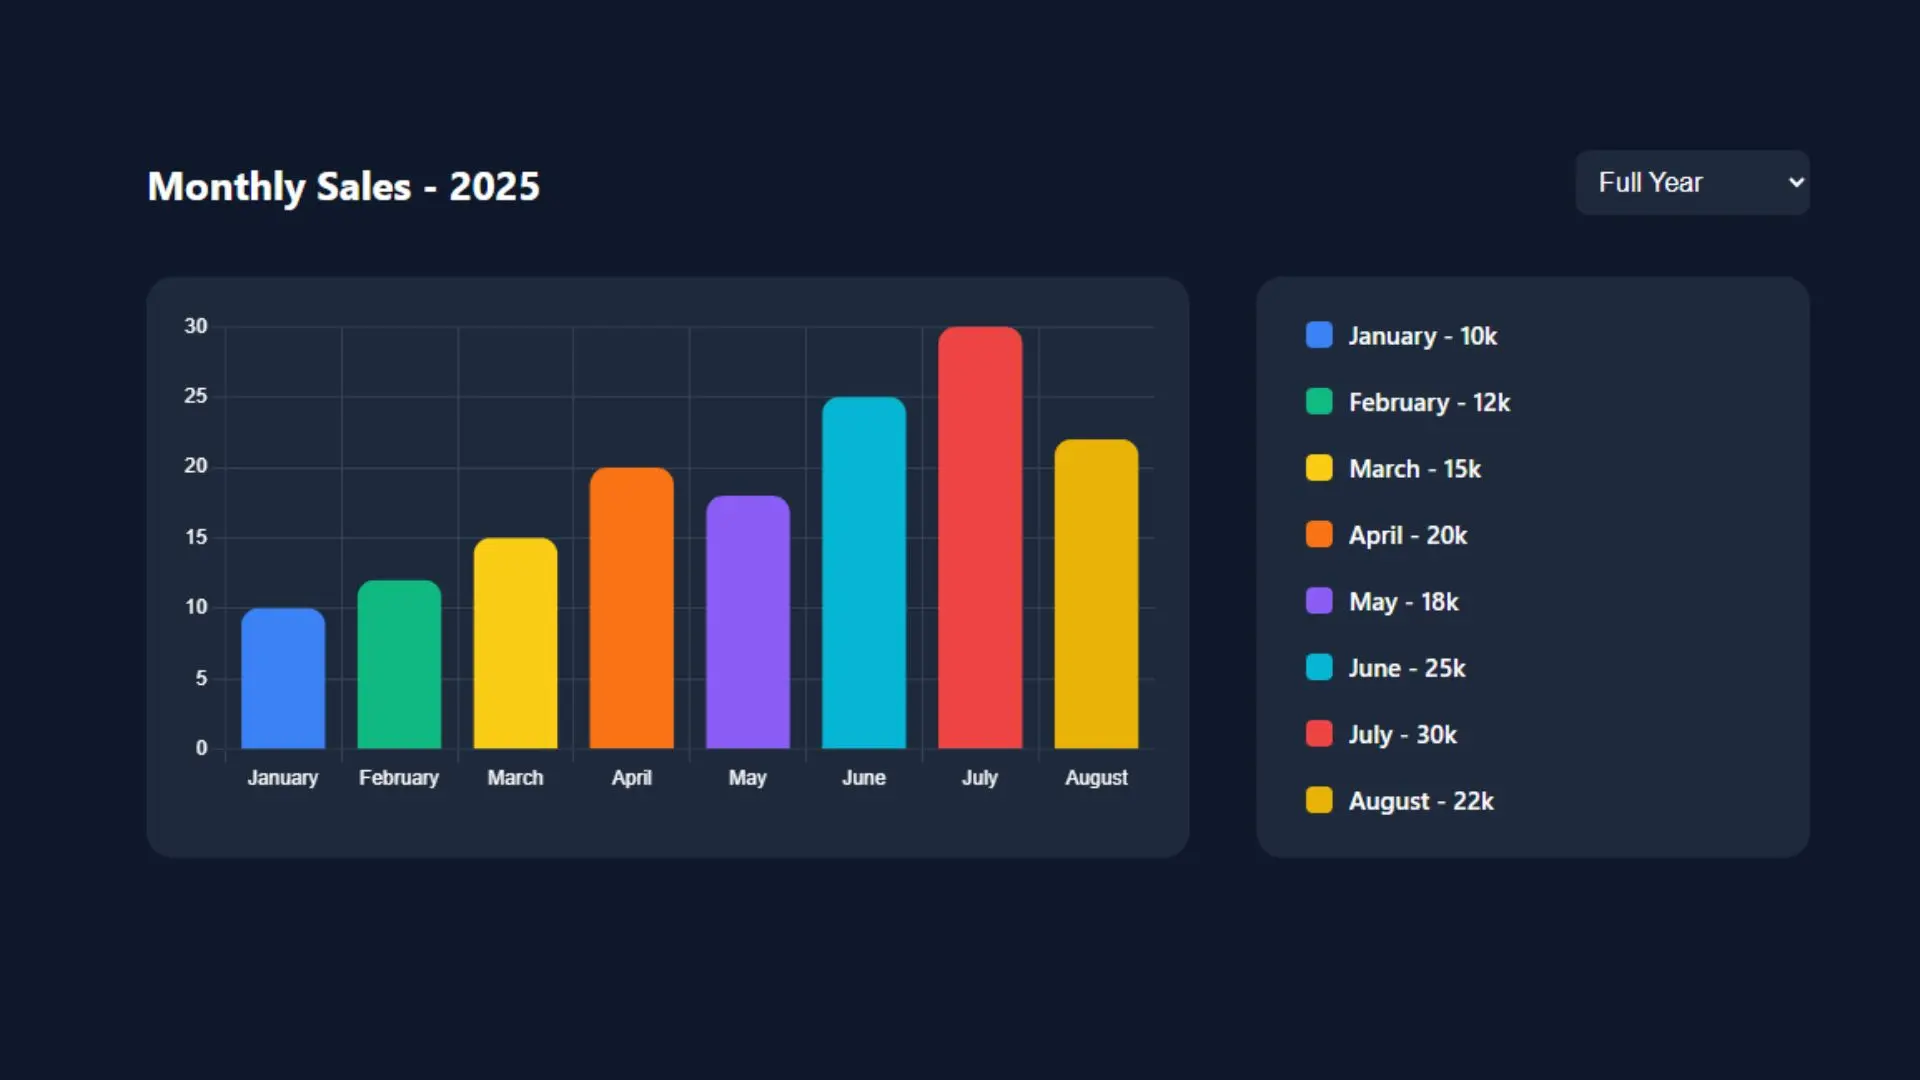
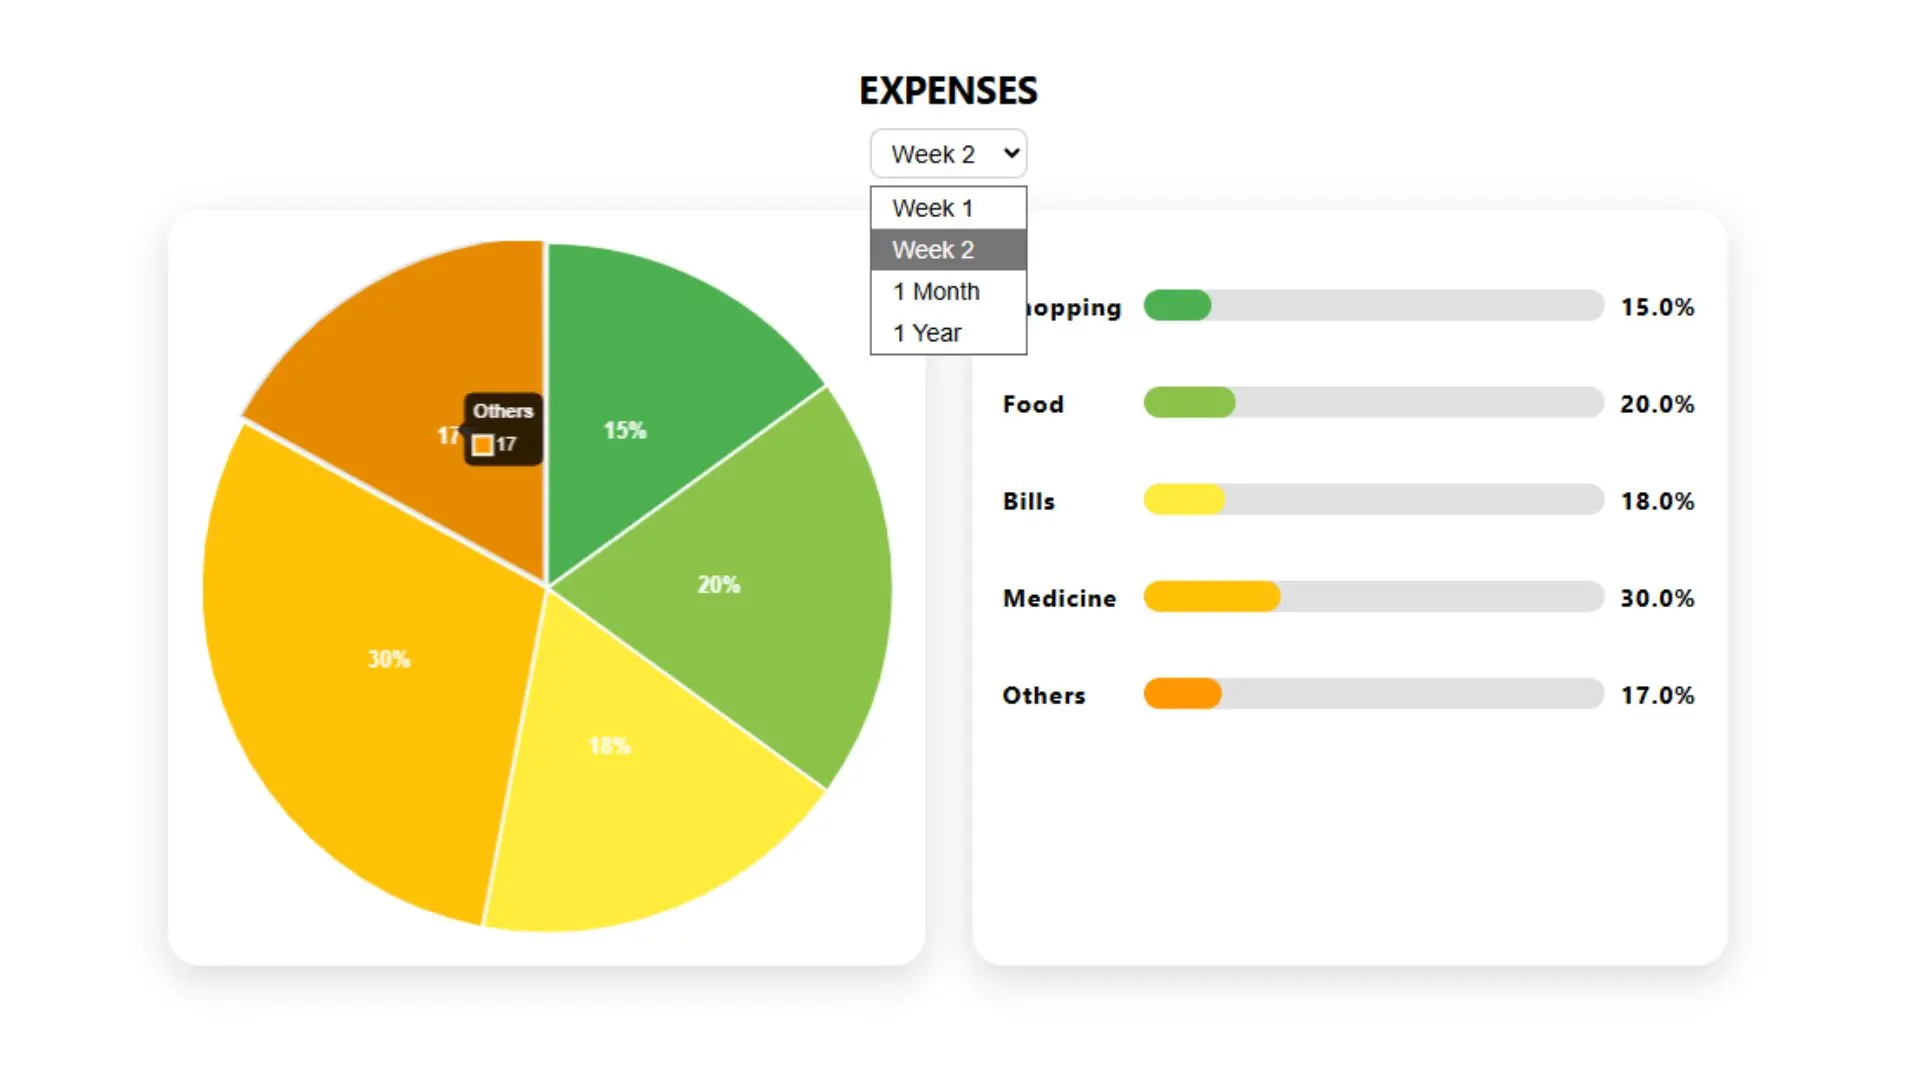
Users can switch between the last 6 months or the full year view. This component is perfect for admin dashboards, analytics tools, SaaS panels, and eCommerce reporting systems, helping users gain meaningful insight from dynamic data sets.
Built with HTML, CSS, JavaScript, and Chart.js
Displays monthly sales data using a smooth line graph
Responsive layout (mobile & desktop friendly)
Toggleable data points via custom legend
6-month or full-year range switch
Dark mode friendly design
Customizable color-coded data points
Easily embeddable in dashboards, reports, and admin panels
SaaS analytics dashboards
eCommerce sales visualization
Product performance reports
Admin and back-office dashboards
Web app statistic panels
Client presentations for agencies
| Last Update | November 24, 2025 |
| Published | August 04, 2025 |
| Resolution Screen | YES |
| Included Files | HTML | CSS | JAVASCRIPT |
| Support Browsers | ALL |
| Use FrameWork | no framwork |
| Software Version | HTML5, CSS3, Vanilla JavaScript (ES5/ES6) |
| Tags | Chart.js | Sales Chart | Line Chart Component | Responsive Graph | Admin Dashboard Chart | Analytics Component | JavaScript Data Viz | Monthly Sales Graph | Interactive Chart | Frontend Data Visualization |
Be the first to know. Subscribe today and unlock exclusive deals!
Working Days / Hours!
Free support line!
Orders Support!

