2
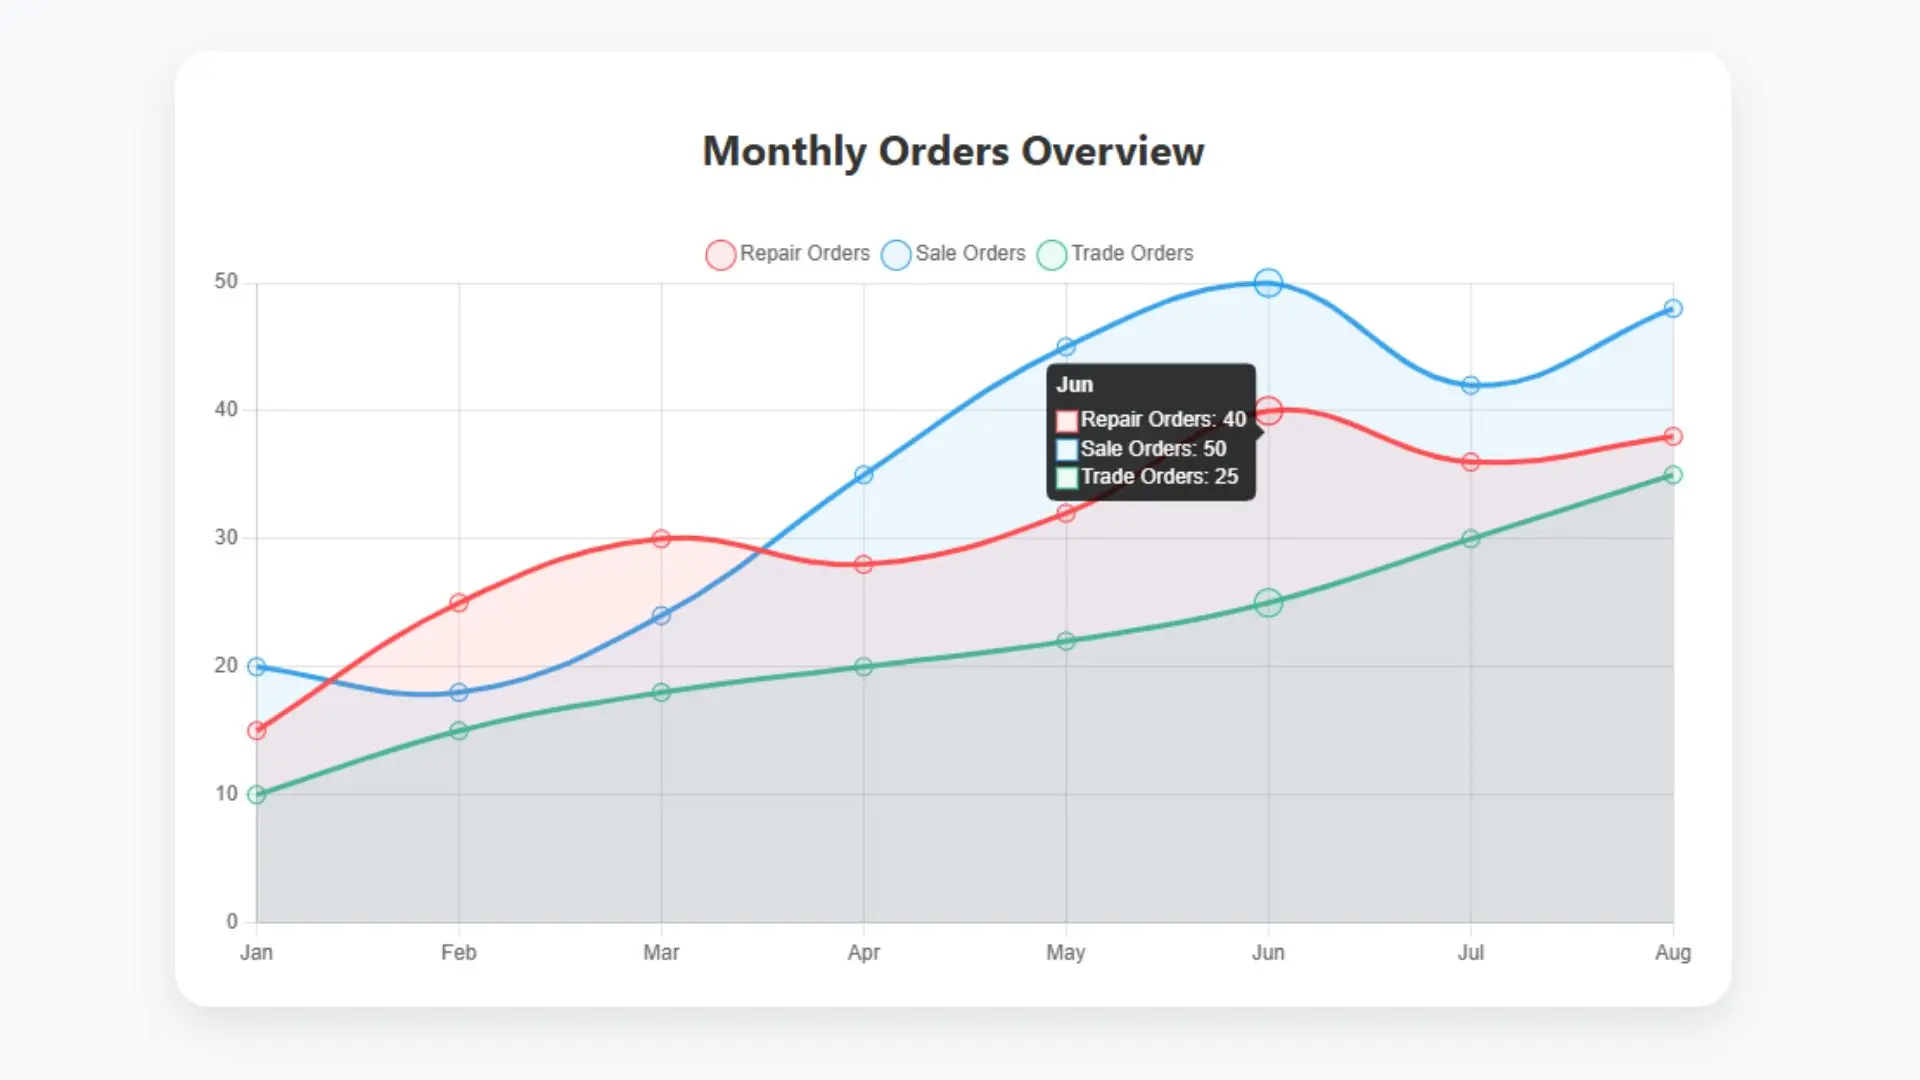
This Multi-Line Chart Component is built using HTML, CSS, JavaScript, and Chart.js to visualize multiple data sets such as Repair Orders, Sale Orders, and Trade Orders over months. It features smooth curves, custom colors, filled areas, and tooltips, making it ideal for dashboards, admin panels, or analytics pages.
Key Features:
Clean & modern responsive layout
Built with Chart.js (latest CDN)
Multiple datasets with smooth lines
Hoverable tooltips and legends
Easily customizable colors and data
Mobile & desktop friendly
Lightweight and fast loading
Great for dashboards, analytics, SaaS apps
Use Cases:
Display monthly reports (sales, orders, users, etc.)
Dashboard components (CRM, ERP, Admin Panels)
Financial or business performance visualizations
Analytics sections on websites or SaaS apps
| Last Update | November 24, 2025 |
| Published | August 04, 2025 |
| Resolution Screen | YES |
| Included Files | HTML | CSS | JAVASCRIPT |
| Support Browsers | ALL |
| Use FrameWork | no framwork |
| Software Version | HTML5, CSS3, Vanilla JavaScript (ES5/ES6) |
| Tags | multi-line chart | responsive chart | chart.js line chart | analytics component | HTML chart component | JavaScript graph | admin dashboard chart | monthly report graph | performance visualization | interactive graph UI |
Be the first to know. Subscribe today and unlock exclusive deals!
Working Days / Hours!
Free support line!
Orders Support!

