1
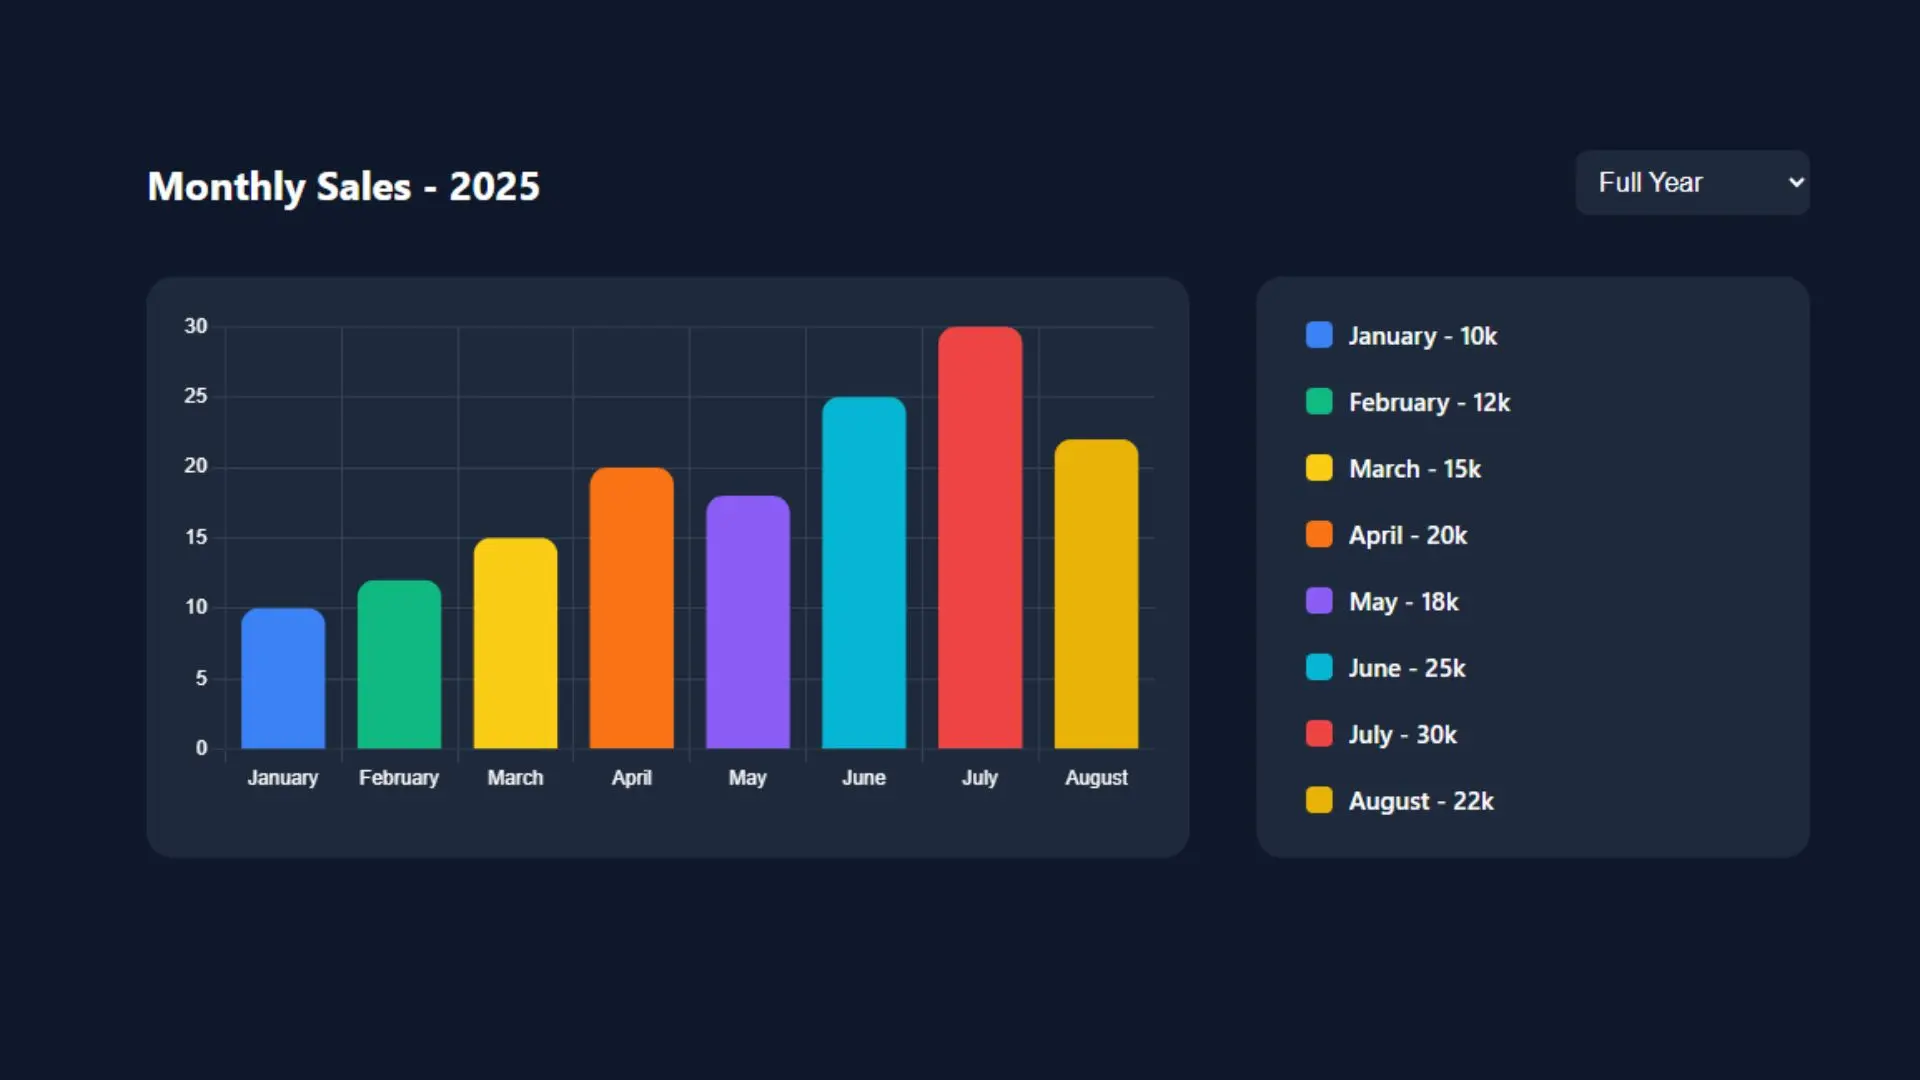
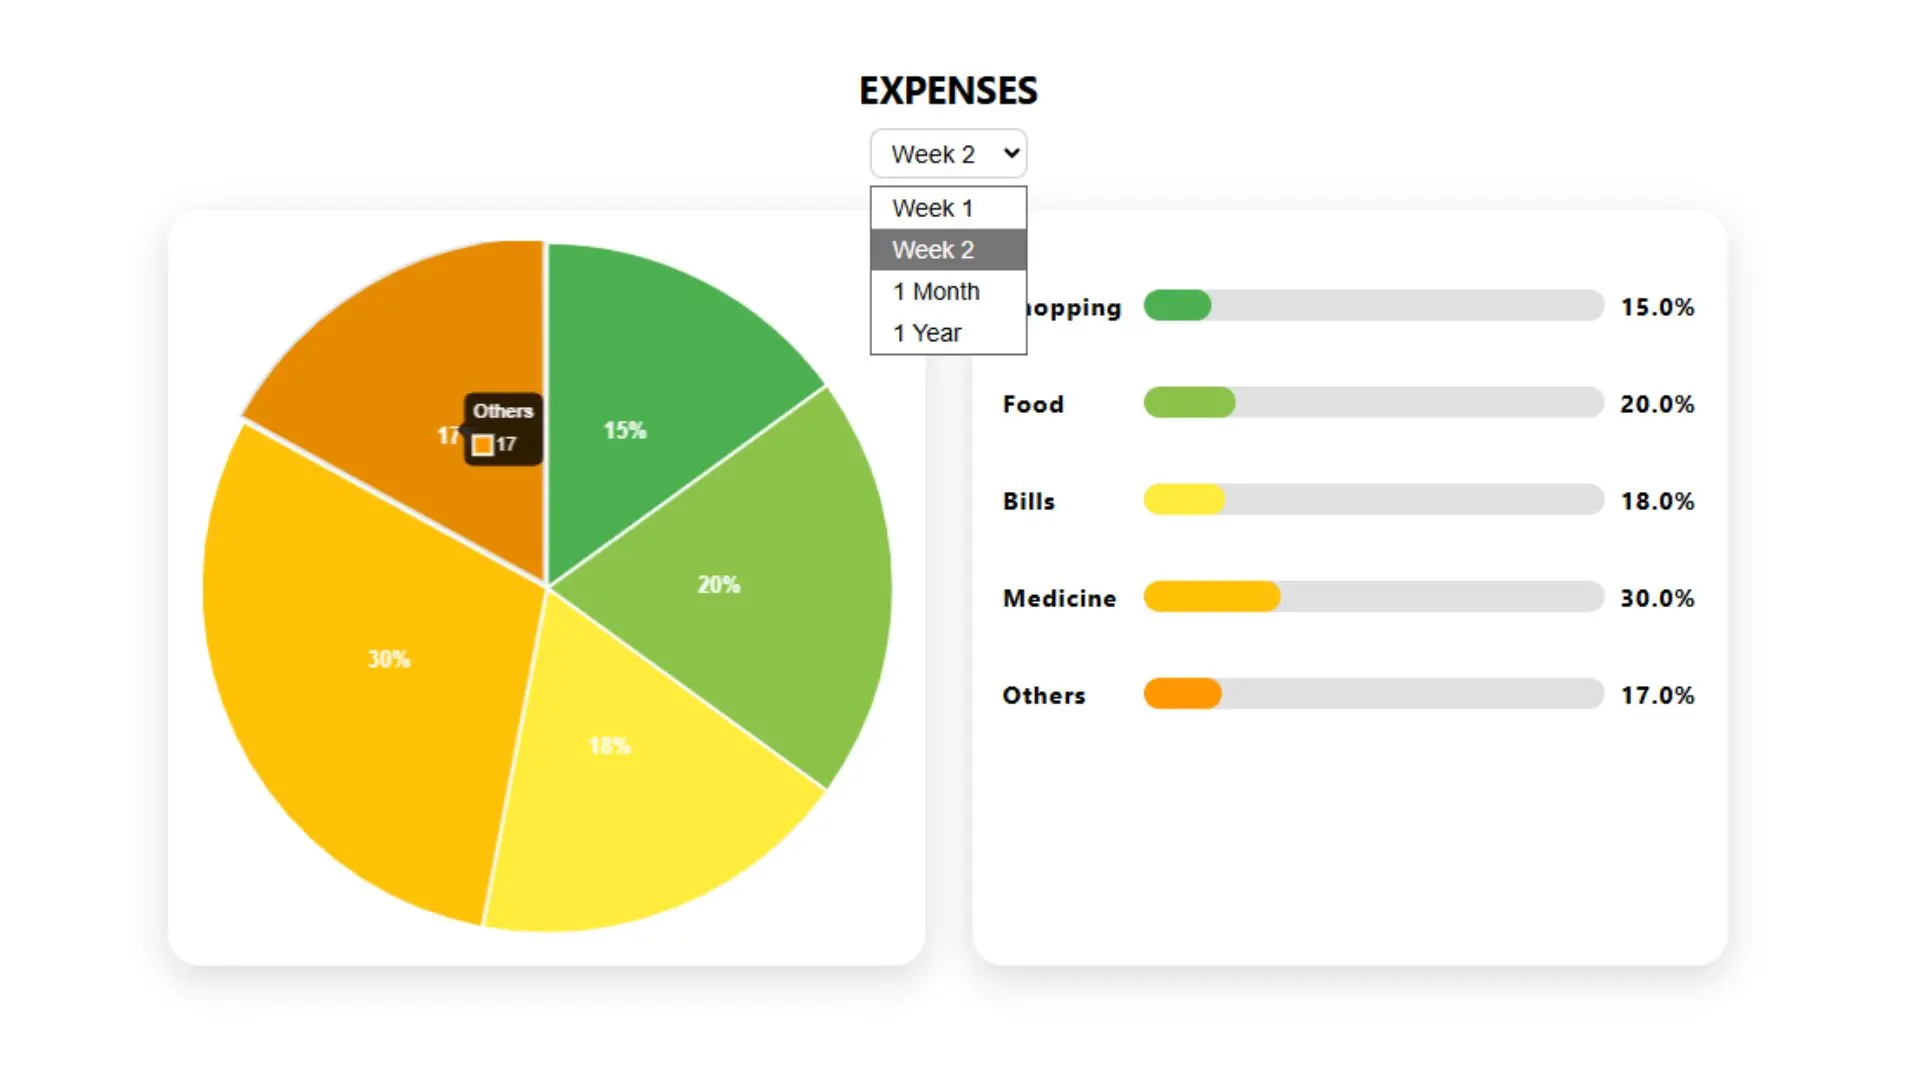
This Dynamic Sales Chart Component is a fully responsive and interactive chart built with HTML, CSS, JavaScript, and Chart.js. It allows users to visualize monthly sales data with customizable time ranges (last 6 months or full year). The component includes a custom legend, colored bars, and smooth toggling of data via user interaction.
Ideal for business dashboards, admin panels, financial overviews, eCommerce analytics, SaaS reporting tools, and any frontend requiring visualized statistics.
Built with HTML, CSS, JavaScript + Chart.js
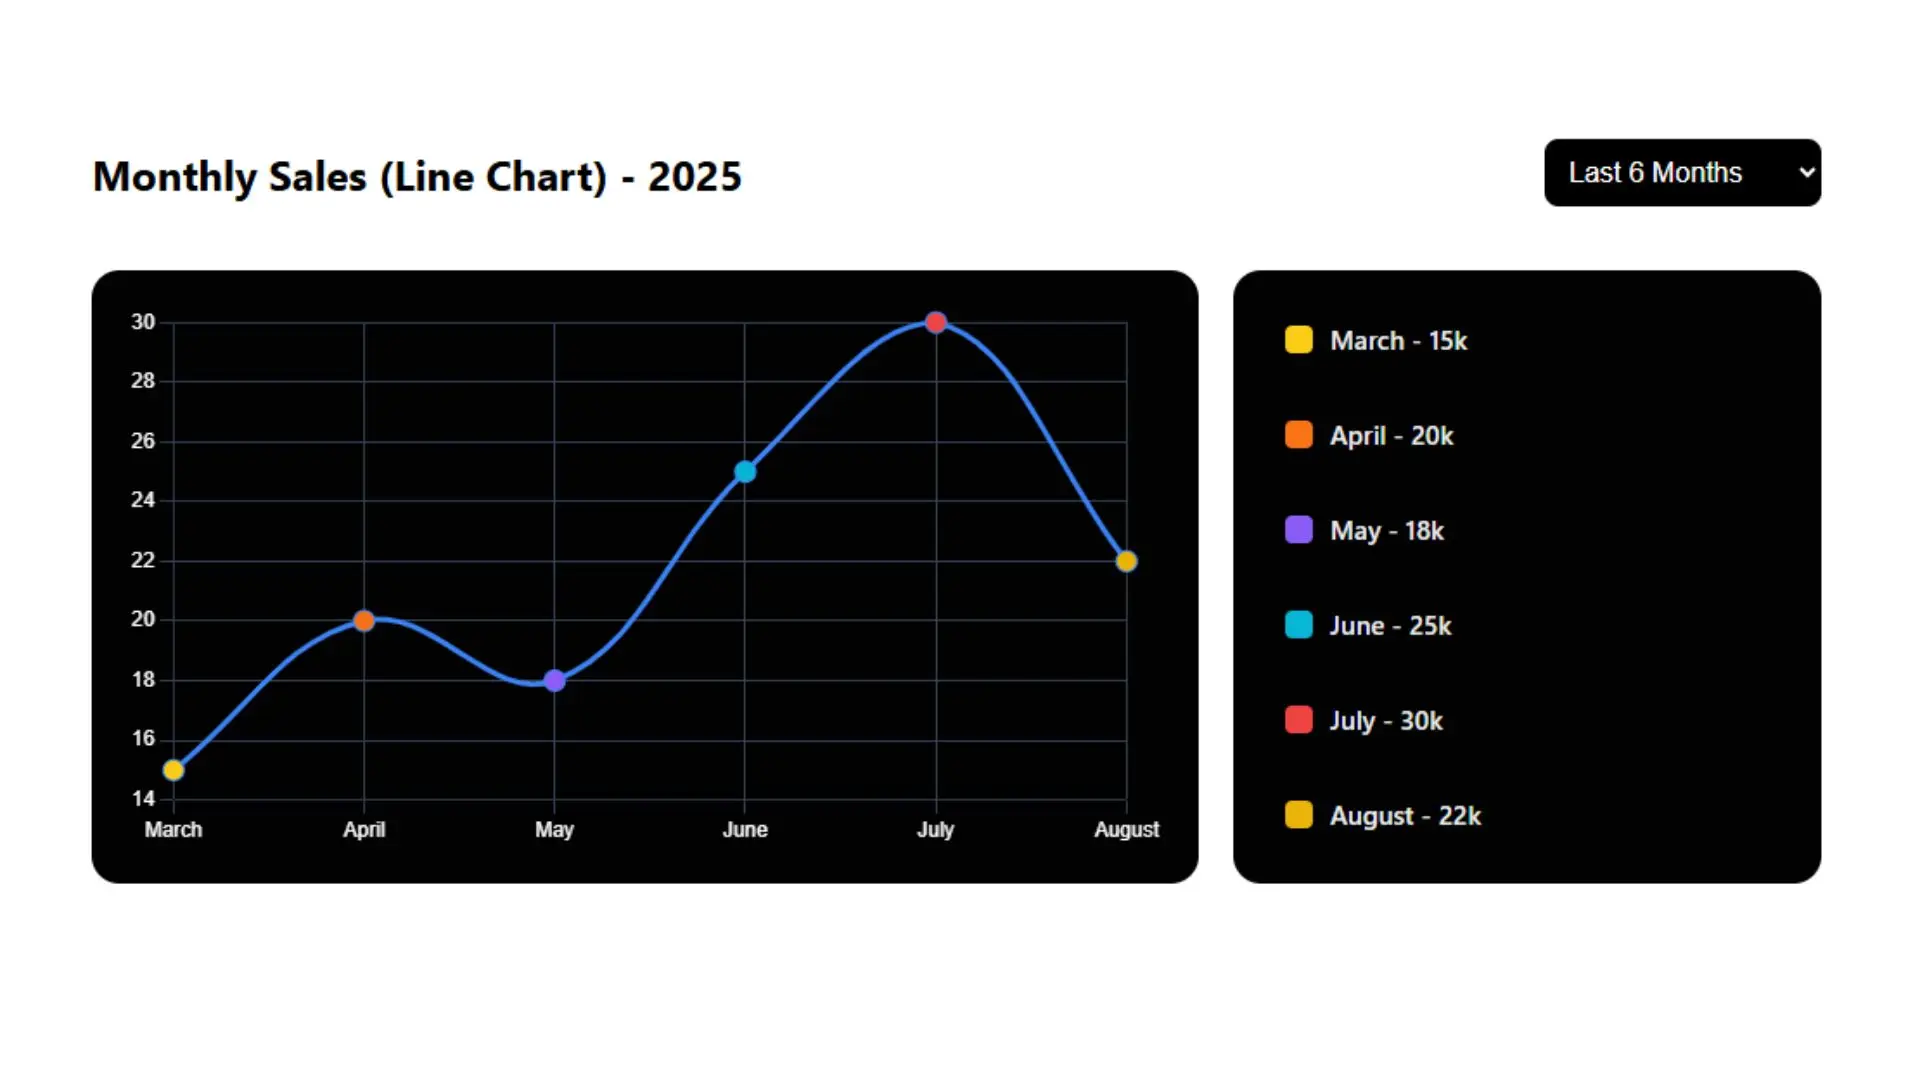
Interactive bar chart with monthly sales visualization
Custom legend with toggle visibility
Supports last 6 months or full year filter
Color-coded bars for better clarity
Mobile-friendly and fully responsive
Dark theme styling with modern design
Easy to integrate into any dashboard or web app
Admin or analytics dashboards
eCommerce sales tracking
SaaS product user statistics
Web apps and reporting tools
Marketing performance reports
Financial management UIs
| Last Update | September 01, 2025 |
| Published | August 04, 2025 |
| Resolution Screen | YES |
| Included Files | HTML | CSS | JAVASCRIPT |
| Support Browsers | ALL |
| Use FrameWork | no framwork |
| Software Version | HTML5, CSS3, Vanilla JavaScript (ES5/ES6) |
| Tags | Chart Component | Sales Chart | Chart.js | Data Visualization | Admin Dashboard | Responsive UI | Monthly Analytics | Custom Chart Legend | JavaScript Components | Frontend Data Tools |
Be the first to know. Subscribe today and unlock exclusive deals!
Working Days / Hours!
Free support line!
Orders Support!

